


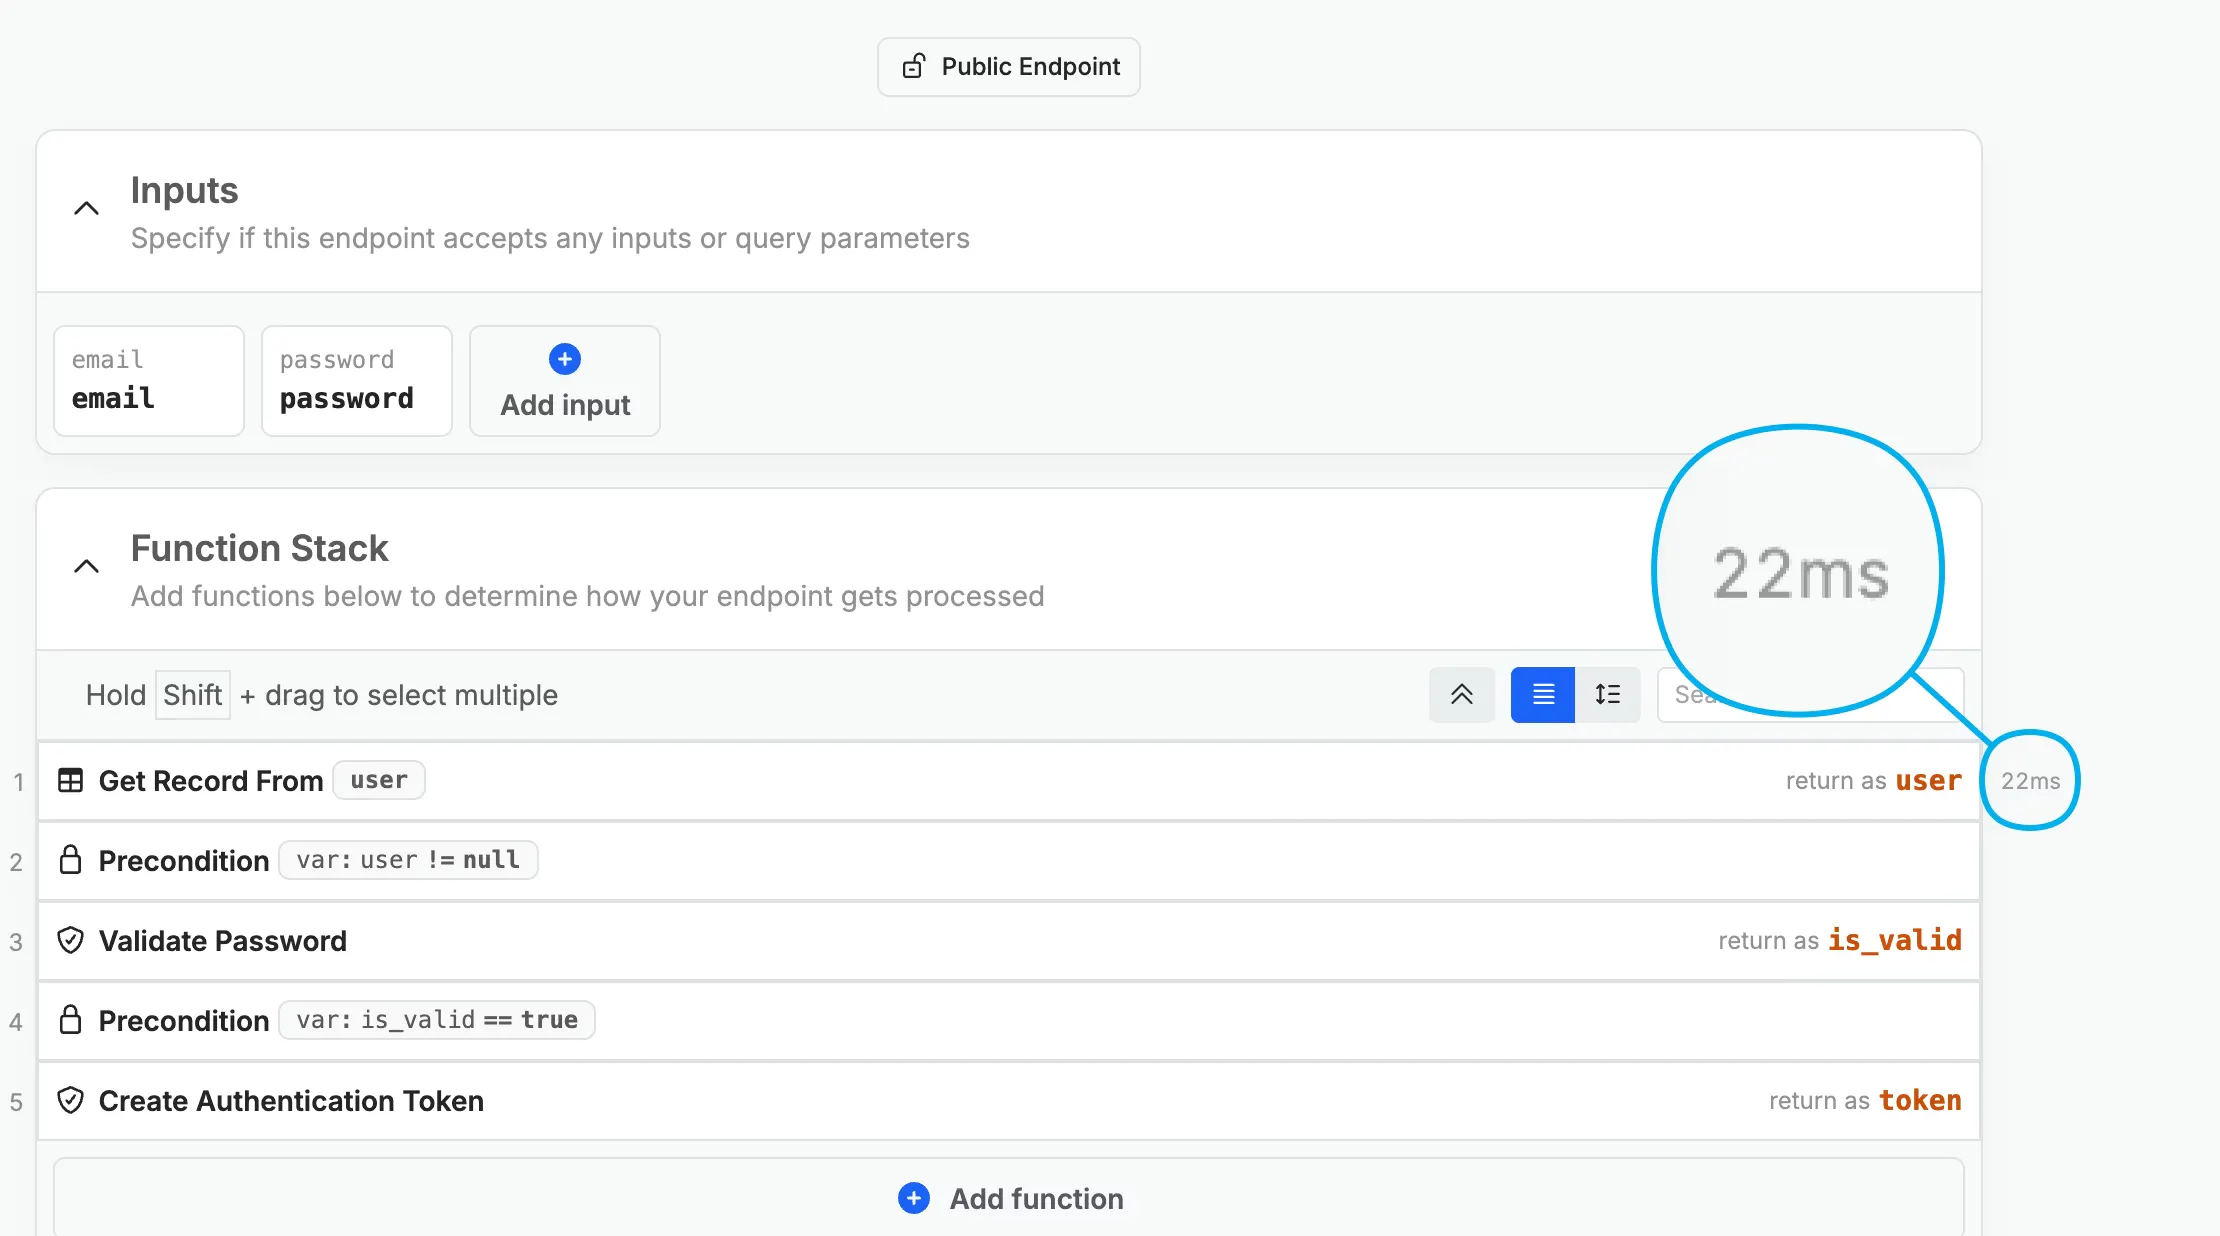
Performance Insights now surfaces execution time for each individual statement directly inline in the function stack—visible on hover, without leaving the editor. You can toggle the inline metric on or off per-user in Workspace Settings.
Error snapshots captured by Error Logs can also be opened directly in the stack, giving you a continuous path from spotting an error to investigating the performance of the logic around it.
Workspace-level Performance Insights already showed which endpoints are slow—but pinpointing the specific statement responsible meant cross-referencing timing data outside the editor. Bringing execution timing inline closes that loop so you can see exactly where time is being spent at the statement level, right where you're already reading and editing logic. Our updated Performance Insights documentation is here in case you want to learn more.
